
10 Years of Chat History on Facebook
Everyone has a unique communication style online. Some of us are online all the time (guilty), some of us not… not so much. We can chat in short bursts or in long paragraphs, we can use emoji or avoid them altogether. I wanted to take a look at how my own interactions online compared to my friends. With this goal in mind, I dove into some of my data found through Facebook, and pulled some of the most interesting findings to share here. If you’re interested in the code for this work, take a look at the full notebook.
Data Ingestion
Facebook has a handy way to download all of your information in one (very) large .zip file. You can find a history of your posts, comments, photos, and messages all in one place. For this analysis, I just focused on Messenger data, which includes all private direct messages and groupchats sent through Facebook.
The data is structured a series of folders, one per thread, and each folder contains one JSON file with all messages. The final master dataset contained a total of 613,195 total messages across ten years of data (starting in 2010) and 897 unique threads. The full notebook can be found here.
Initial EDA
Before we get into anything too dramatic, let’s get a lay of the land.
First, a quick life story…
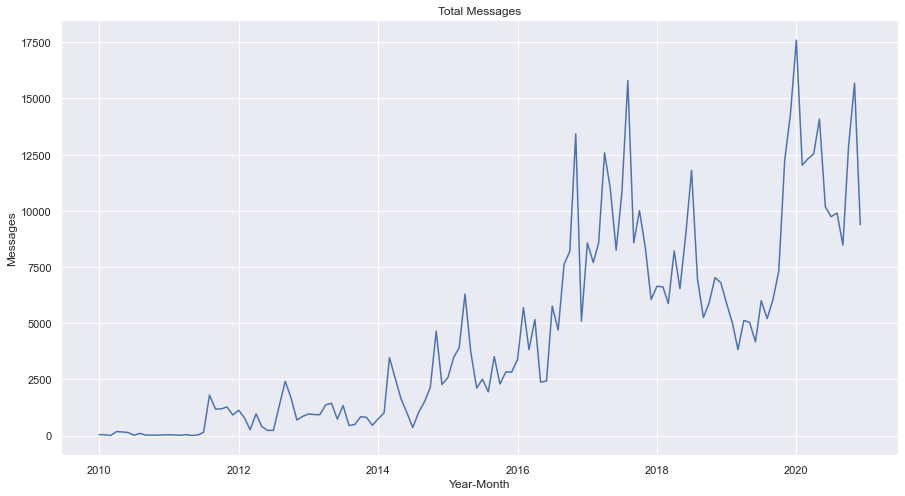
You can see that I sent my first message in January of 2010, when I was still in high school. Relatively speaking, I was a late adopter of Facebook, but we can see I caught up quickly. I started undergrad at Carnegie Mellon in 2013, from where you can see a steady increase in messaging. Interestingly, I’ve found that students vary in their preferred communication by college. While most of my friends at CMU preferred Facebook for all communication (to the point where we often never had each others’ actual phone numbers), students from other universities stuck to SMS texting or GroupMe chats. You can actually see this shift after graduation, when I moved to Chicago to start my first full time job in 2017. I started interacting with my Chicago friends over text, and my Facebook message volume declined.
Finally, note Facebook’s return in late 2019, when I was traveling for work and then in 2020, at the height of the pandemic. My internet communication at that point skyrocketed due to the lockdowns, and you can see the corresponding volume increase in the chart.
Other things worth noting
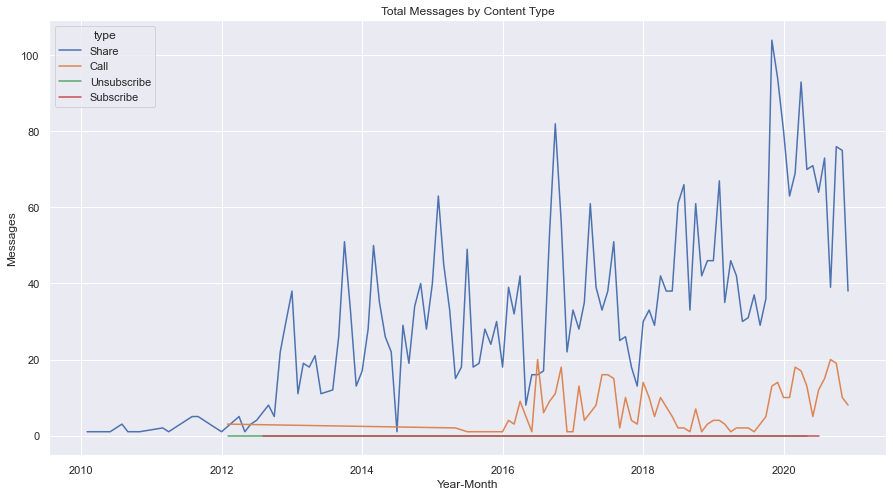
Facebook considers any interaction on Messenger as a message. This means that my 613K number above is slighly inflated, since those messages include things like shares from other platforms, voice and video calls, and entries and exits from groupchats.
Interestingly, actions such as changing the chat colors also get logged as a seperate message. For my analysis, I kept these in, but wiped the messages for things like “Sender X has left the group chat” in order to avoid inflating character counts. Calls were kept in, but there was a negligible amount (460) compared to the total.
Findings
Now for the fun stuff! I spent an unmentionable amount of time digging through the stats of how my friends and I interact.
Sentiment Analysis
I used vaderSentiment to score every message and gauge average positive/negative sentiment over time. The chart below shows an average compound score by month. The more positive the number, the more positive the average sentiment is for that given time period.
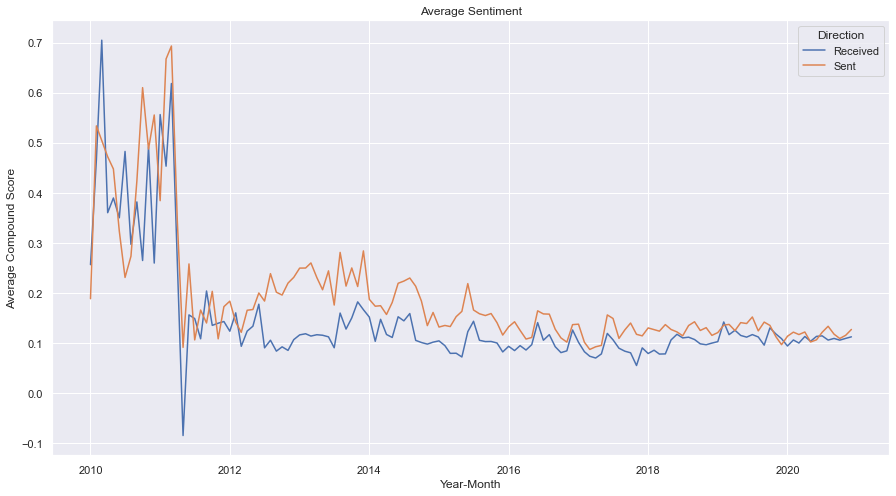
You can see that the first year or so of data is quite volatile. This is due to the relatively small number of messages sent and received. Otherwise, we can also see that I was signficantly more positive in the texts I sent out (in blue) versus the texts I received in return (in orange). This changed as I got older, and adjusted my communication style to match that of my friends. You could also read this as a personality change. Perhaps, as I grew up, I became a little less naive… Or a little more cynical? Who knows! More interestingly, I’m curious to test the accuracy of these findings; comparing different sentiment analysis tools could be an entirely separate blog post.
Profanity
I also used a package called better-profanity to scan each message for profane content. This package is extremely thorough and identifies a wide variety of things it considers inappropriate. I found it to have roughly the tolerance of a fifth grade teacher - words like “screwed” and “crap” were also flagged, but overall it was a great measure of relative profanity across different threads and senders. Here’s another chart showing the percentage of messages I’ve sent and received containing profanity:
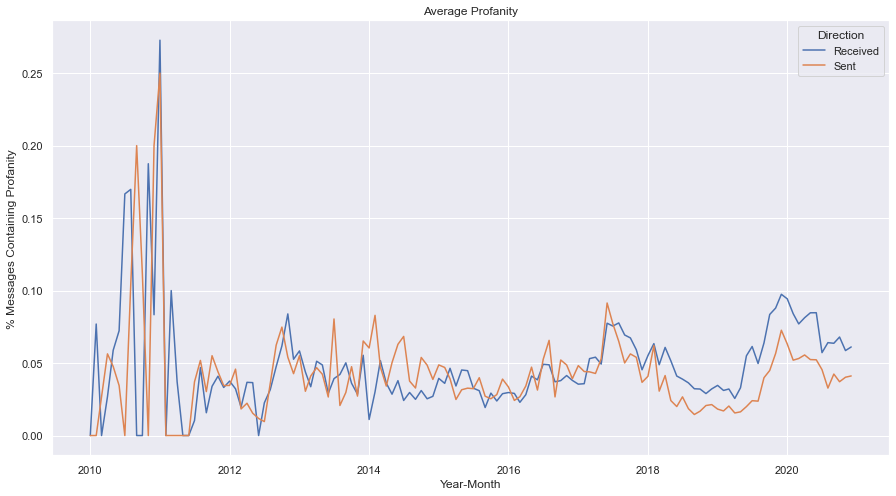
I was struck in looking at the data at how perfectly my sent and received curves mirrored each other, so I dug a little deeper. Below you can see the average percent profanity score for my top 50 threads.
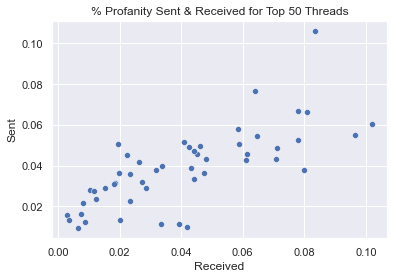
There is a small but noticeable positive correlation here, suggesting that as I interacted with friends with fewer filters, I adjusted my behavior to match.
Correlations
I was also interested in seeing if certain behaviors for certain senders were highly correlated. By aggregating the data to the sender level and identifying key characteristics, I built the following correlation matrix:
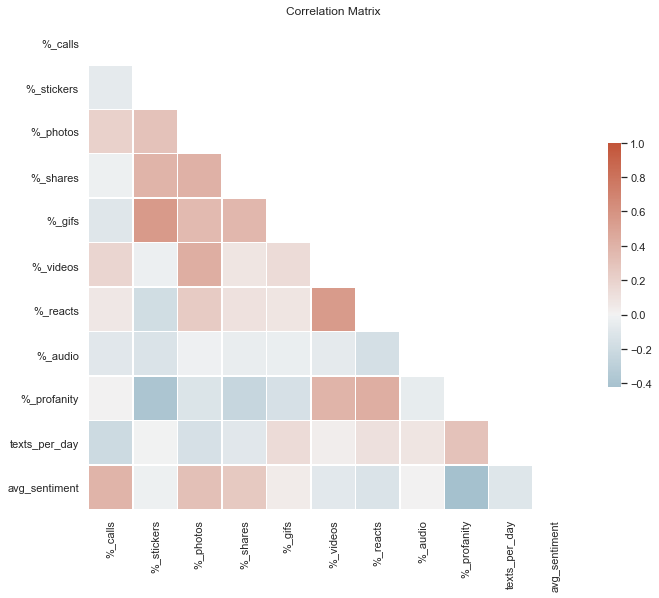
This wasn’t all that surprising, but you can tell that senders with high GIF usage also tended to use more stickers and send more photos. Unsurprisingly, profanity had a negative correlation with sentiment. However, senders with high profanity usage tended to receive more reacts (the emoji you can assign to a specific message as a reaction). You could definitely argue that profanity at least evokes a strong emotional response!
Coming soon
Future additions to this blog:
- Deep dive into a single thread and how our friendship has evolved over time
- NLP applications - TF-IDF, ngrams, and Top2Vec